System Components
A detailed examination of the architectural zones, component inventory, working principles, and engineering metrics that form the foundation of the audit and forensics platform.
1.1 System Architecture
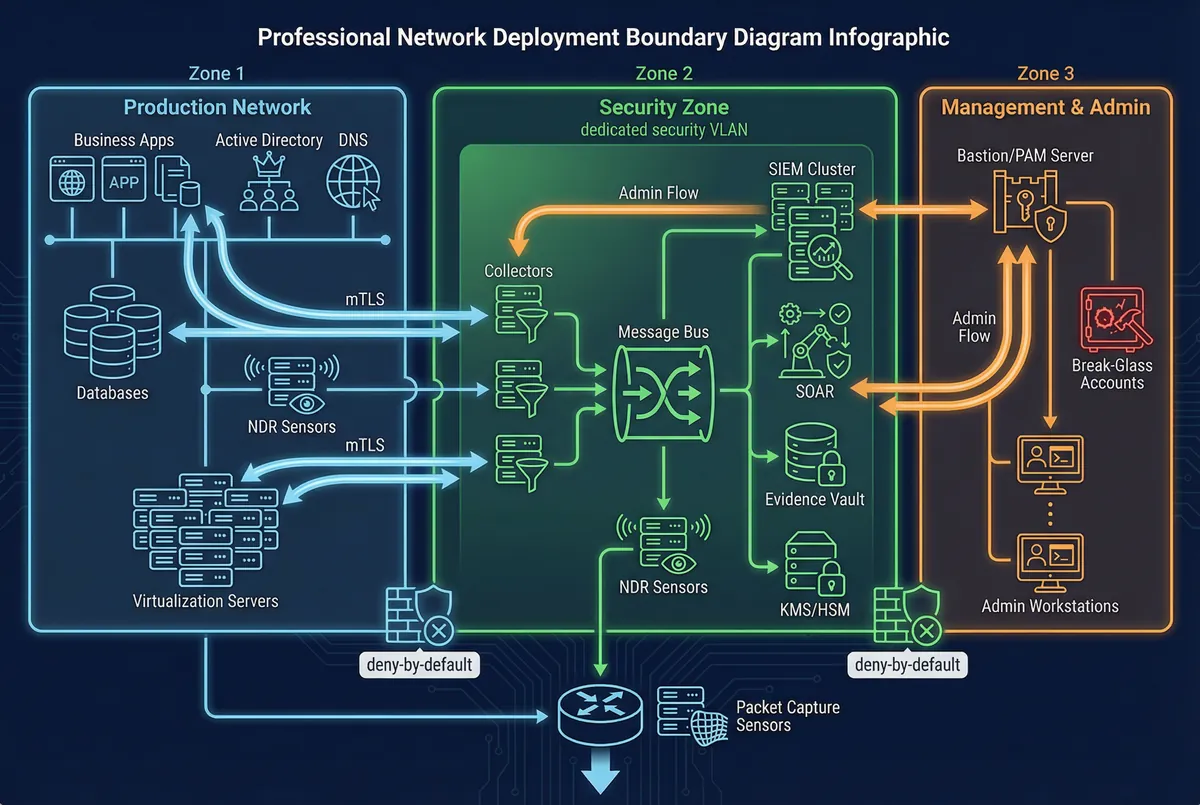
The audit and forensics platform is organized into three distinct deployment zones, each with clearly defined responsibilities, access controls, and data flow boundaries. This zonal architecture ensures that evidence collection, processing, and storage remain isolated from production workloads while maintaining operational efficiency and administrative control.
Zone 1, the Production Network, encompasses all business-generating systems: applications, databases, Active Directory/LDAP, DNS, and virtualization platforms. These systems are the primary evidence sources — they generate authentication events, application access logs, configuration changes, and operational telemetry. All outbound log traffic from Zone 1 travels via mTLS-encrypted channels to collectors in Zone 2, ensuring confidentiality and integrity during transit.
Zone 2, the Security Zone, is a dedicated security VLAN hosting the entire audit pipeline: log collectors, message bus, SIEM cluster, SOAR platform, evidence vault, and KMS/HSM. Firewall rules enforce a deny-by-default posture, permitting only inbound log flows from Zone 1 collectors and outbound management access to the bastion in Zone 3. This isolation prevents lateral movement from production into the audit infrastructure and ensures that evidence cannot be tampered with from the production network.
Zone 3, the Management and Admin zone, hosts the bastion/PAM server, hardened admin workstations, and break-glass accounts. All administrative access to both Zone 1 and Zone 2 components flows exclusively through the bastion, which enforces MFA, records full sessions, and maintains tamper-evident command logs. Optional packet capture sensors are deployed at network egress points, and NDR sensors monitor critical segments within Zone 1.
Module Relationship & Data/Control Flows
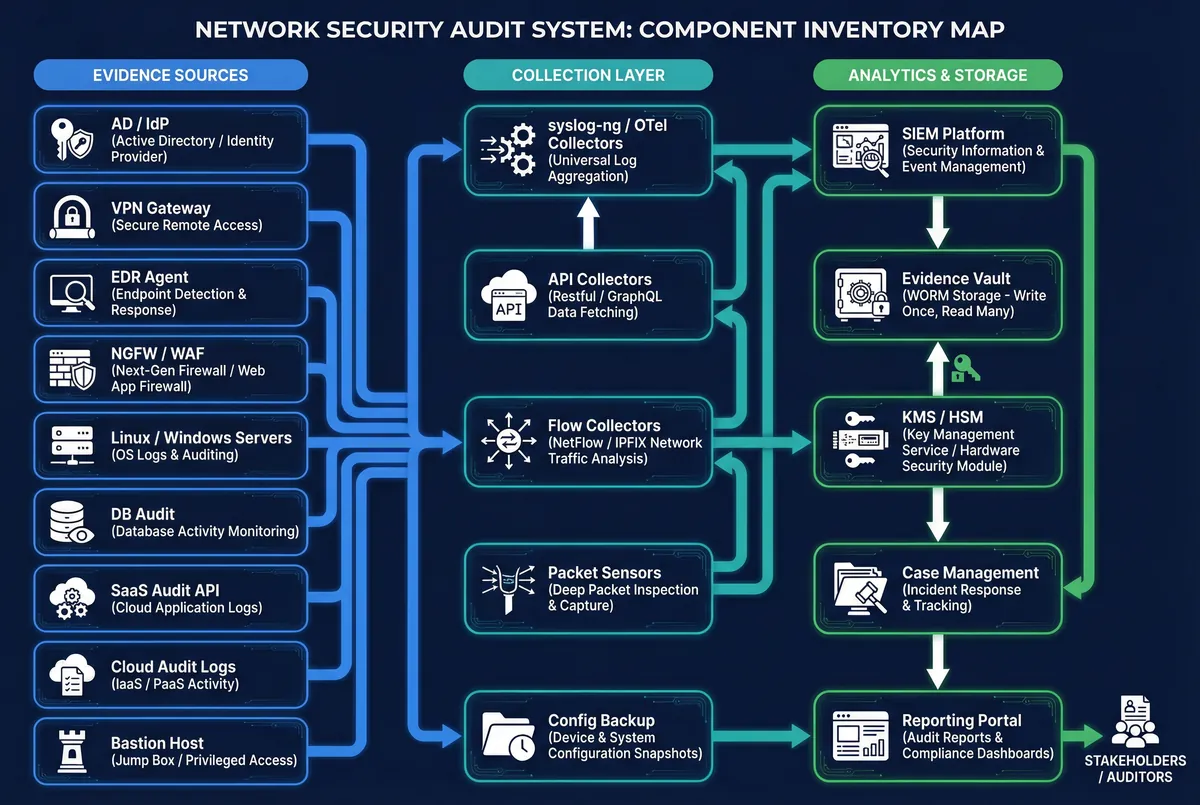
The platform operates through a well-defined sequence of data and control flows that ensure every event is captured, validated, normalized, and preserved with cryptographic integrity. Collectors receive syslog/TLS streams, agent events, and API-pulled data, performing first-stage validation including time skew checks and mandatory field verification. The transport bus buffers events and enables replay, decoupling ingestion throughput from SIEM indexing capacity. The normalization pipeline converts vendor-specific formats into a canonical schema enriched with asset IDs, user IDs, geographic context, and business service tags. The SIEM indexes hot data and drives correlation, dashboards, and detection rules, while the evidence vault stores immutable evidence objects with signed manifests.
Core vs. Optional vs. Supporting Components
- Core (mandatory): NTP service, IAM audit integration, bastion session recording, log normalization pipeline, SIEM hot indexing, immutable evidence vault, chain-of-custody workflow.
- Optional (recommended): Full packet capture beyond egress points, memory dumps at scale, SOAR automation, User and Entity Behavior Analytics (UEBA).
- Supporting (infrastructure): UPS/power conditioning, rack/room physical security, network segmentation, backup network paths, secure admin endpoints.
1.2 Components and Functions
The platform comprises a comprehensive set of components spanning evidence sources, collection infrastructure, analytics engines, and storage systems. Each component has clearly defined responsibilities, input/output interfaces, key engineering metrics, and documented mismatch risks that guide procurement and acceptance testing.
| Component | Responsibility | Key Engineering Metrics | Typical Mismatch Risk |
|---|---|---|---|
| NTP Service (redundant) | Unified time base for all systems | Max skew ≤1s (audit), ≤100ms (PCAP correlation) | Incident timelines cannot be proven in legal proceedings |
| Log Collectors (mTLS) | Secure ingest + local buffering | Ingest EPS, drop rate <0.1%, spool hours 24–72h | Packet loss during log bursts; evidence gaps |
| Schema Registry | Field standardization and versioning | Schema drift alerts, parse error rate <0.5% | Inconsistent fields break cross-source correlation |
| Enrichment/CMDB Mapping | Asset/account attribution mapping | Enrichment hit rate >95% | "Unknown host/user" gaps impede attribution |
| SIEM Hot Index | Search, correlation, and detection | Search latency, EPS capacity | Slow queries impede incident response speed |
| Evidence Vault (WORM) | Immutable long-term retention | Object lock success 100%, integrity scan pass rate | Tampering allegations undermine legal admissibility |
| Hash/Sign Service | Cryptographic integrity proof | Verify pass rate 100%, signing latency per GB | Evidence authenticity challenged in proceedings |
| Bastion/PAM | Privileged control + session recording | Admin coverage 100%, recording availability | "Admin did not do it" disputes without proof |
| Packet Capture Sensors | Traffic reconstruction capability | Sustained Mbps capture, retention days | Insufficient capture window for lateral movement |
| Config Backup/Versioning | Change reconstruction evidence | Backup success >99%, diff freshness | Configuration changes untraceable during incidents |
1.3 Working Principles
Startup and Initialization
System startup follows a defined sequence to ensure evidence integrity from the first event. NTP sync validation occurs first: collectors reject events from sources with skew exceeding the configured threshold (typically 5 minutes) and automatically open a remediation ticket. Collector health checks verify queue/bus readiness, disk spool capacity, and TLS certificate validity. The parser warm-up phase loads the latest schema versions and mapping tables for asset and user enrichment, ensuring all incoming events are immediately normalized against current definitions.
Steady-State Operation
During normal operations, sources continuously send events over encrypted transport channels. Collectors validate mandatory fields and tag each event with a source trust level. The normalization pipeline enriches events with asset context, user identity, and business service tags before the SIEM indexes hot data. The evidence vault simultaneously stores immutable raw and normalized copies with signed manifests. Alerts generated by detection rules create cases in the case management system, with evidence packages automatically appended as custody entries are created.